Has Take Two’s (TTWO) Stock Found a Bottom?

TTWO

Take Two (TTWO) Looks to End Downtrend After Developing A Double Bottom

Despite blowing away analyst estimates during their most recent quarter, Take Two Interactive (TTWO) stock is down 5% since reporting, flat from where I recommended purchasing shares in anticipation of stronger than expected Grand Theft Auto V sales. I still view TTWO as a strong long-term buy, and believe their downside is very limited from their current levels given their massive cash position and extremely valuable intellectual property portfolio. Both Microsoft’s (MSFT) Xbox One and Sony’s (SNE) PlayStation 4 sold over 1 million units on their release day, positive signs for the industry as a whole heading into the holiday season.

Looking at their chart we can see that Take Two has traded down sharply on the open the past two sessions, but bounced strongly off of the $16.35 level and recouped their initial losses each day, forming a very defined double bottom pattern. Shares could run into some resistance at $17, but a move above that level would confirm their short-term reversal and set the stage for a move higher. Take Two shares are currently at a very attractive entry point and I believe $16.35 will prove to be the floor for TTWO’s stock price moving forward.

Disclosure: I have no positions in any stocks mentioned, and no plans to initiate any positions within the next 72 hours. I wrote this article myself, and it expresses my own opinions. I have no business relationship with any company whose stock is mentioned in this article.

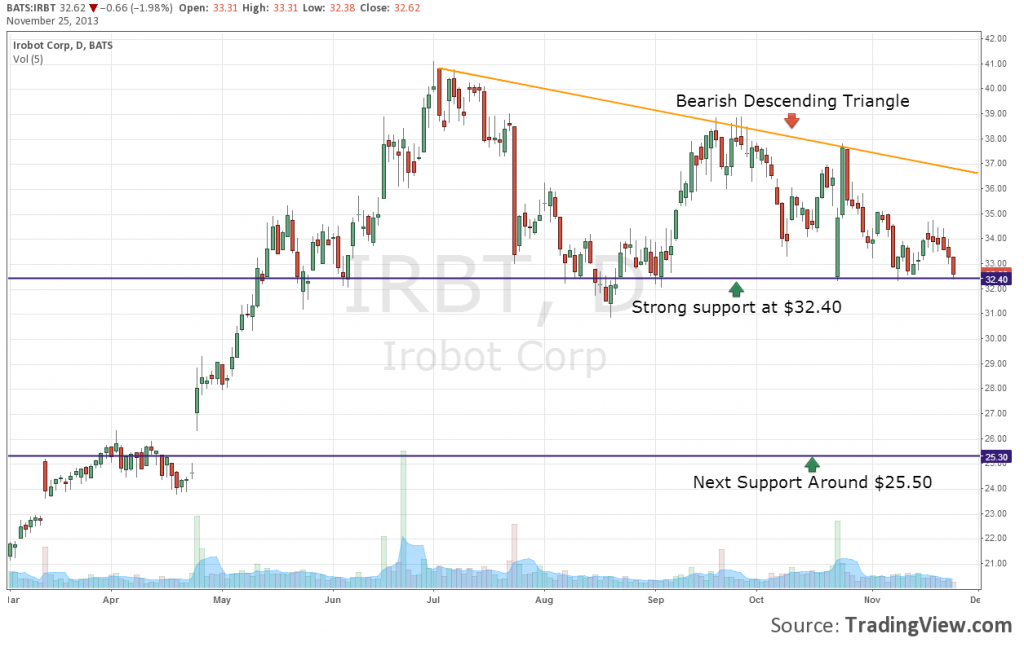
iRobot (IRBT) Stock in Descending Triangle Pattern

IRBT

iRobot (IRBT) Stock Nears Test of Important Support Level, Chart Pattern is Bearish

Despite a strong run for equities the past few months, shares of iRobot (IRBT) are down more than 20% from their 52 week high of $41 set in July. Best known for their robotic cleaning devices such as the floor-vacuuming Roomba, iRobot disappointed investors with their 3rd Quarter results, reporting revenue and guidance that came in below analyst expectations. IRBT shares are currently in a bearish descending triangle pattern which began in July, and are near a key support level around $32.40. The pattern indicates that demand for their shares has been declining, with a series of lower highs made each time IRBT has bounced off support the past 5 months. Traders should pay close attention to the price action of IRBT stock this week as it tests $32.40. A break to the downside would trigger a sell signal with their chart showing no levels of support to the downside until the $25- 26 range.

Disclosure: I have no positions in any stocks mentioned, and no plans to initiate any positions within the next 72 hours. I wrote this article myself, and it expresses my own opinions. I have no business relationship with any company whose stock is mentioned in this article.

Sirius XM Radio (SIRI) Nearing Support, Remains In Long-Term Uptrend

SIRI

Sirius XM Radio (SIRI) Stock Nears Lower Bollinger Band, Trend Still Bullish

Since late 2008, Sirius XM Radio (SIRI) stock has been one of the market’s best and most consistent performers, with shares up more than 2,500% in the past 5 years. Near at a post-merger high heading into their latest earnings release, expectations were sky-high. Despite reporting very good numbers, showing strong year over year growth and re-affirming their outlook, their stock was sent lower as many investors were disappointed that SIRI didn’t raise guidance. In the subsequent weeks shares have continued to track down, closing today at $3.64. While some may assume their uptrend must be broken considering their recent price action, if you look at their long-term chart it is easy to see that the trend remains very strong still. SIRI was approaching overbought levels prior to earnings, now shares could be considered close to oversold as they near their lower Bollinger Band. Sirius XM has made enormous strides in terms of revenue growth and profitability in the past few years and will generate $915 million in free cash flow this year, money which will be used to fund a $2 billion buyback announced by SIRI last month. With solid fundamentals and future growth prospects, a shareholder friendly management team actively returning capital to investors, and short-term technical support provided by their Bollinger Bands, SIRI is currently at an attractive level for those looking to enter a long-term position. Their uptrend remains very much intact.

Disclosure: I have no positions in any stocks mentioned, and no plans to initiate any positions within the next 72 hours. I wrote this article myself, and it expresses my own opinions. I have no business relationship with any company whose stock is mentioned in this article.
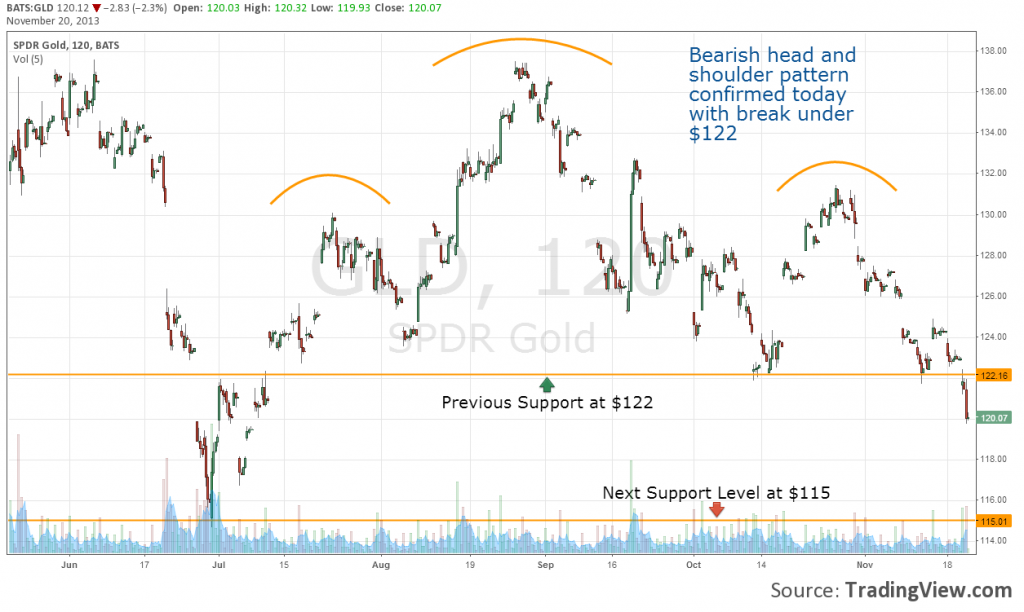
SPDR Gold Shares (GLD) Selling Off, Heading Lower

GLD Head and Shoulders

Head and Shoulders pattern suggests SPDR Gold Shares (GLD) is a sell

A very bearish head and shoulders pattern has formed in SPDR Gold Shares (GLD) chart the past 5 months. Support at $122 has been broken and GLD shares currently sit at $120. Looking at their chart, their next level of support appears to be at $115 in the short-term. We heard from the Fed Minutes today that tapering could be on table within the next few meetings. A strong jobs report for November would increase the likelihood that the central bank will start scaling back their stimulus program as other economic data has been looking better as of late. These measures are inevitable despite Bernanke and Yellen’s comments suggesting their willingness to keep the current program in place and have the potential to send GLD significantly lower.

Disclosure: I have no positions in any stocks mentioned, and no plans to initiate any positions within the next 72 hours. I wrote this article myself, and it expresses my own opinions. I have no business relationship with any company whose stock is mentioned in this article.

Facebook (FB) stock plummets, downtrend remains intact

FB 2

Facebook (FB) fails to confirm break out, shares down sharply

After signaling a possible break out from their descending channel on Friday, shares of Facebook (FB) fell 6.5% today, indicating that their downtrend remains intact. The key level for FB to hold today was $49, shares gapped down from Friday’s close and trended down the remainder of the day, closing at their lowest price in more than a month. In what was a very bearish day for Facebook stock and the entire social media sector as a whole, shares failed to find support at $48 and could be headed lower in the short term unless a base can be formed at $46 during the next few trading sessions. We will be monitoring FB’s action closely this week.

Disclosure: I have no positions in any stocks mentioned, and no plans to initiate any positions within the next 72 hours. I wrote this article myself, and it expresses my own opinions. I have no business relationship with any company whose stock is mentioned in this article.

Bank of America (BAC) Nears Key Technical Level

BAC

Bank of America (BAC) Stock Has Momentum, Closing in on 52 Week High

After trending down for the past 2 1/2 months shares of Bank of America (BAC) have picked up some momentum, broke their downtrend, and are within 1% of their 52 week high. BAC could make a run at $15 today, and should  meet some resistance at that price. Given the recent strength of BAC, a move north of this level seems likely from a technical perspective. To get an idea of where shares could be headed from there we can check out a long term chart of Bank of America and see that there is not significant resistance until shares reach $18, which would represent a 20% upside from current levels. Should Bank of America fail to cross $15 and remain above that price in the short term, look for them to trend back down towards $13.75 before finding support. Their price action this week should be monitored very closely if you have a position in BAC or are currently considering entering one as it nears this key technical level.
BAC Long Term
Disclosure: I have no positions in any stocks mentioned, and no plans to initiate any positions within the next 72 hours. I wrote this article myself, and it expresses my own opinions. I have no business relationship with any company whose stock is mentioned in this article.

Facebook (FB) Shares Break Out of Downtrend

FB

Facebook (FB) Stock Forming Base at $49, Trading Above Descending Channel

Despite reporting earnings that easily exceeded expectations, some comments from the conference call spooked investors and sent shares of Facebook (FB) into a downtrend for the past month. Last week FB broke through the upside of their descending channel and appear to be forming a floor at $49. I viewed the market’s reaction to management’s comments during the CC as irrational and overstated and believe their long-term growth prospects are still well-intact. If shares have truly broke out of their downtrend and are forming a base at $49, this level should prove to be an attractive long-term entry point. We will be monitoring their price action closely today, looking for FB to remain above $49 and confirm their break out.

Disclosure: I have no positions in any stocks mentioned, and no plans to initiate any positions within the next 72 hours. I wrote this article myself, and it expresses my own opinions. I have no business relationship with any company whose stock is mentioned in this article.

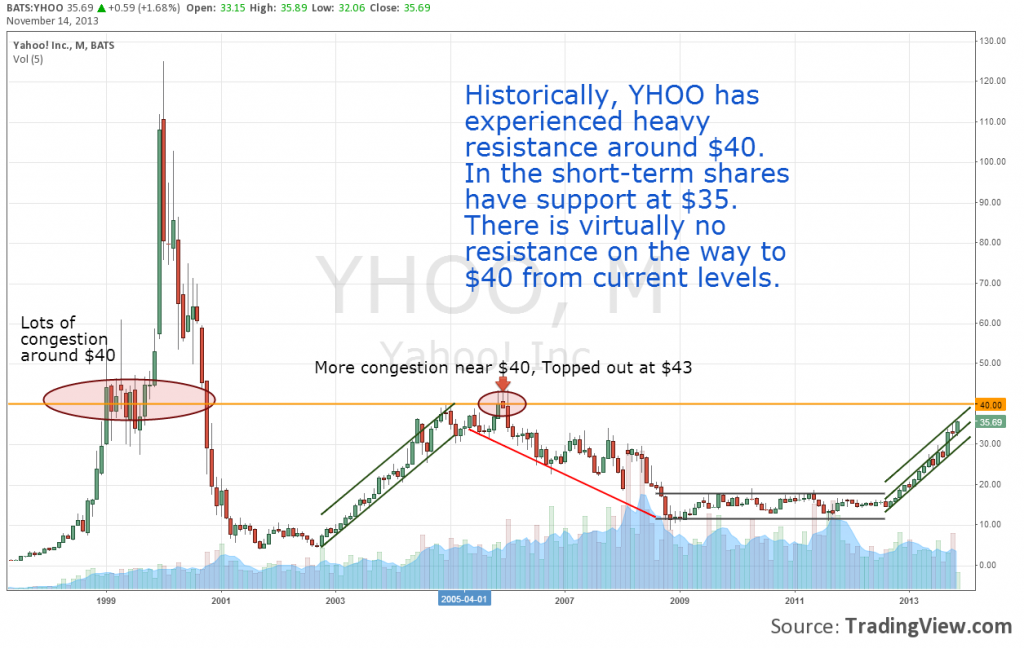
How long will Yahoo (YHOO) Shares Keep Running

YHOO Long Term

Yahoo (YHOO) Could Find Resistance at $40

Yahoo (YHOO) shares have had quite a run as of late, up 10% in their last 5 trading days. After using a short-term chart of YHOO to anticipate their action this week, with shares now at a 7 year high it is necessary to take a look their long-term chart to determine where shares may next run into resistance. Looking at all available price action data available on Yahoo’s stock, we can see that historically shares have been met with a good deal of resistance near $40, only eclipsing that figure for a meaningful amount of time during the internet bubble of 1999. Coincidentally, when analyzing Yahoo’s fundamentals last month, the high-end of our determined fair valuation range for YHOO was $40. From both a technical and fundamental perspective I believe shares will appreciate by another 12% in the short-term barring a major downturn in the US equity markets.

Disclosure: I have no positions in any stocks mentioned, and no plans to initiate any positions within the next 72 hours. I wrote this article myself, and it expresses my own opinions. I have no business relationship with any company whose stock is mentioned in this article.
Yahoo (YHOO) Shares Close at New 52 Week High

YHOO 4

Yahoo (YHOO) Stock at 52 Week High, Highest Price Since January 2006

Yahoo (YHOO) is making a lot of people look/ feel pretty smart this week as shares continued their surge today. YHOO opened down this morning but remained in a steady uptrend throughout the day, filling the gap on their chart created by yesterday’s price action and setting a new 52 week high in the process. Not just a 52 week high, today was Yahoo’s highest closing price since January 2006. As mentioned yesterday, there is no overhead resistance on YHOO’s chart now and shares have plenty of room to continue their run. In my analysis of Yahoo last month I suggested they were undervalued and that their fair value was in the range of $38- $40 per share. I will review and update my recommendation of YHOO next week if shares continue to close in on my target price.

Disclosure: I have no positions in any stocks mentioned, and no plans to initiate any positions within the next 72 hours. I wrote this article myself, and it expresses my own opinions. I have no business relationship with any company whose stock is mentioned in this article.
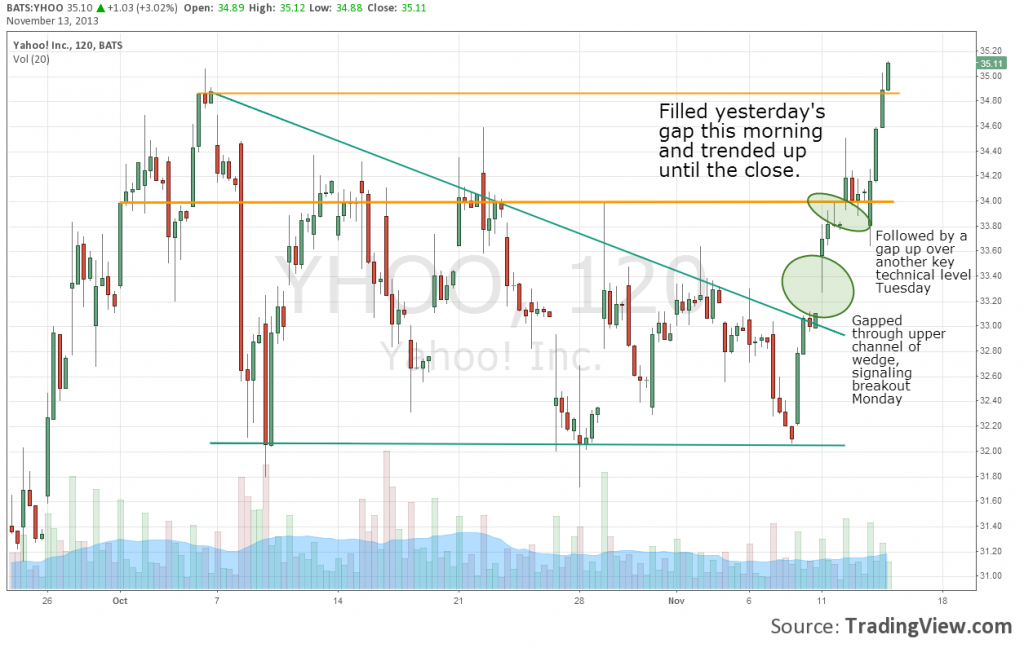
Yahoo (YHOO) Stock Continues Strength, Over $34

YHOO 3

Yahoo (YHOO) Shares Remain Strong

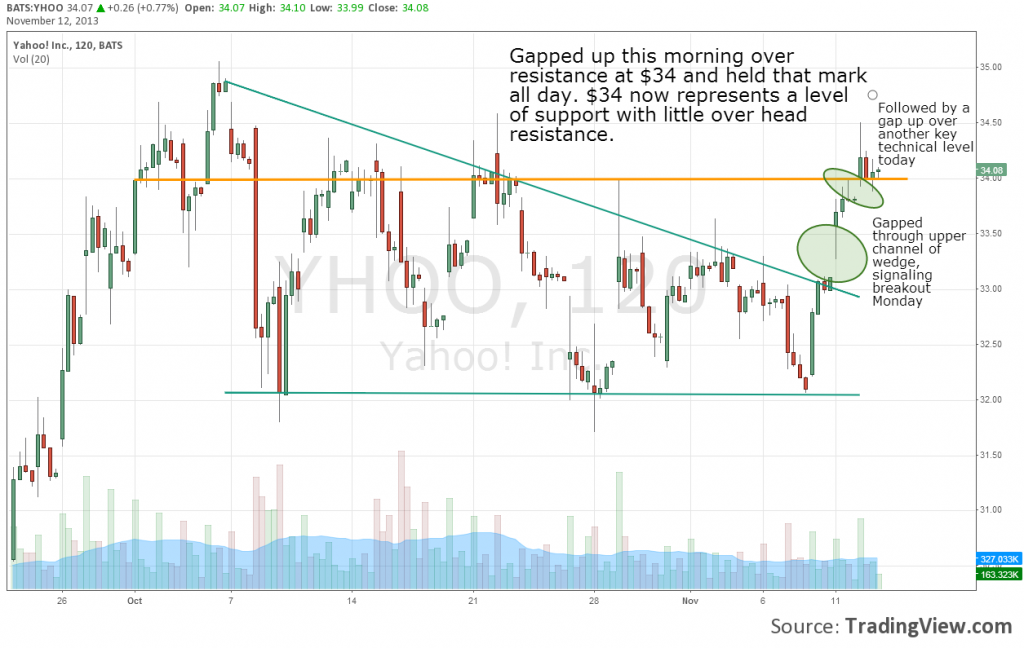
In what is seemingly becoming a daily column, we take a look at Yahoo’s (YHOO) price action once again. After breaking out of a wedge pattern yesterday, YHOO stock gapped up once again today taking out the key $34 level as we had expected. Despite a down day for the markets, Yahoo displayed strength all day and remained above $34. I believe this price will now provide support to the downside, and looking at YHOO’s chart now, there is little overhead resistance to be found. This stock is firing on all cylinders at the moment from a technical analysis perspective.

Disclosure: I have no positions in any stocks mentioned, and no plans to initiate any positions within the next 72 hours. I wrote this article myself, and it expresses my own opinions. I have no business relationship with any company whose stock is mentioned in this article.
Go to top