Even John Paulson is Turning on Gold (GLD)

john paulson

The World’s Biggest Gold Bull Isn’t So Bullish Anymore

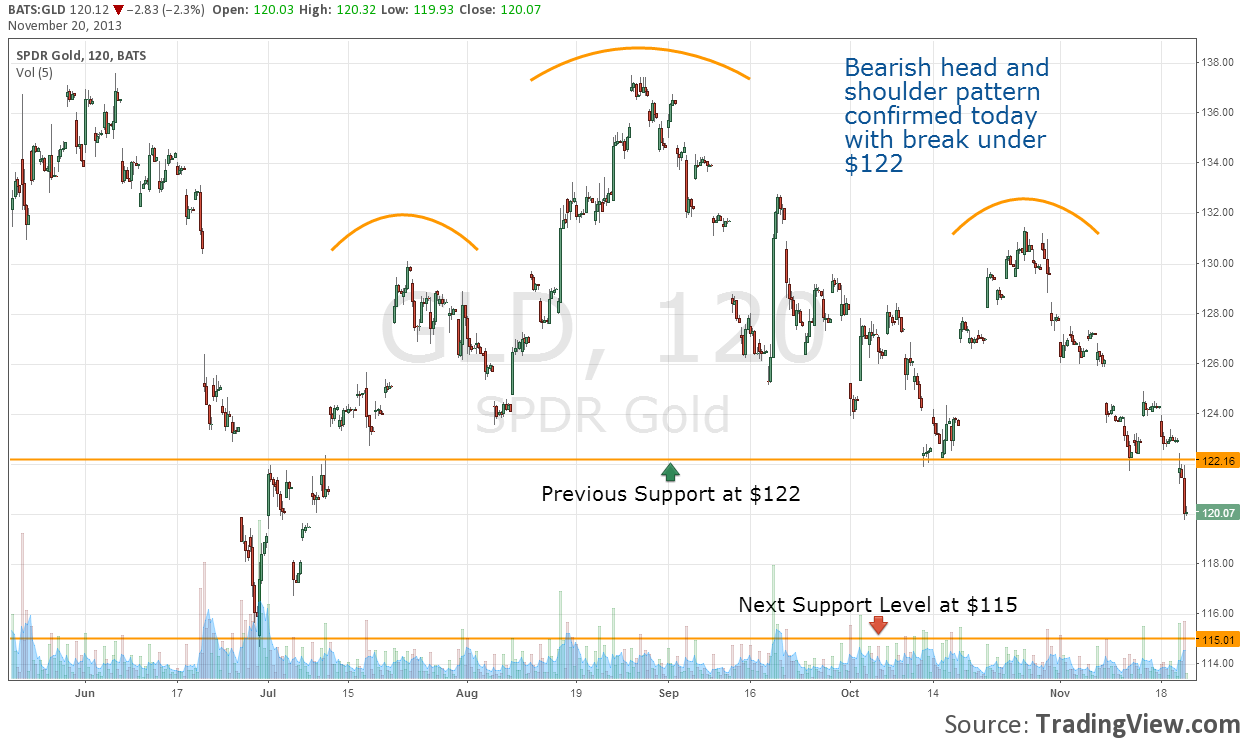
John Paulson,the storied hedge fund manager who netted$20 billion successfully navigating the housing crash and ensuing financial crisis, has been one of the most notable and outspoken gold bulls in recent years. After seeing his PFR Gold Fund drop 63% thus far for the year, he has seemingly lost faith in the precious metal. Despite being the world’s largest investor in SPDR Gold Shares (GLD), owning more than 10.2 million shares as of September 30th, Paulson reportedly has told clients he would not invest any more money in his Gold fund as he is now uncertain as to when inflation will begin to accelerate. At yesterday’s annual meeting Paulson said the fund will maintain their current positions in gold stocks while letting any options related to the metal expire. Already down 26% year-t0-date, GLD certainly looks as if it has yet to bottom out, with a very defined head and shoulders pattern on their chart confirmed by this weeks price action. Perhaps Paulson sees the same developments taking place.

Or perhaps he’s just rotating from bullion to Bitcoin…

Disclosure: I have no positions in any stocks mentioned, and no plans to initiate any positions within the next 72 hours. I wrote this article myself, and it expresses my own opinions. I have no business relationship with any company whose stock is mentioned in this article.

Sirius XM Radio (SIRI) Nearing Support, Remains In Long-Term Uptrend

SIRI

Sirius XM Radio (SIRI) Stock Nears Lower Bollinger Band, Trend Still Bullish

Since late 2008, Sirius XM Radio (SIRI) stock has been one of the market’s best and most consistent performers, with shares up more than 2,500% in the past 5 years. Near at a post-merger high heading into their latest earnings release, expectations were sky-high. Despite reporting very good numbers, showing strong year over year growth and re-affirming their outlook, their stock was sent lower as many investors were disappointed that SIRI didn’t raise guidance. In the subsequent weeks shares have continued to track down, closing today at $3.64. While some may assume their uptrend must be broken considering their recent price action, if you look at their long-term chart it is easy to see that the trend remains very strong still. SIRI was approaching overbought levels prior to earnings, now shares could be considered close to oversold as they near their lower Bollinger Band. Sirius XM has made enormous strides in terms of revenue growth and profitability in the past few years and will generate $915 million in free cash flow this year, money which will be used to fund a $2 billion buyback announced by SIRI last month. With solid fundamentals and future growth prospects, a shareholder friendly management team actively returning capital to investors, and short-term technical support provided by their Bollinger Bands, SIRI is currently at an attractive level for those looking to enter a long-term position. Their uptrend remains very much intact.

Disclosure: I have no positions in any stocks mentioned, and no plans to initiate any positions within the next 72 hours. I wrote this article myself, and it expresses my own opinions. I have no business relationship with any company whose stock is mentioned in this article.

SPDR Gold Shares (GLD) Selling Off, Heading Lower

GLD Head and Shoulders

Head and Shoulders pattern suggests SPDR Gold Shares (GLD) is a sell

A very bearish head and shoulders pattern has formed in SPDR Gold Shares (GLD) chart the past 5 months. Support at $122 has been broken and GLD shares currently sit at $120. Looking at their chart, their next level of support appears to be at $115 in the short-term. We heard from the Fed Minutes today that tapering could be on table within the next few meetings. A strong jobs report for November would increase the likelihood that the central bank will start scaling back their stimulus program as other economic data has been looking better as of late. These measures are inevitable despite Bernanke and Yellen’s comments suggesting their willingness to keep the current program in place and have the potential to send GLD significantly lower.

Disclosure: I have no positions in any stocks mentioned, and no plans to initiate any positions within the next 72 hours. I wrote this article myself, and it expresses my own opinions. I have no business relationship with any company whose stock is mentioned in this article.

Yahoo (YHOO) Announces $5 Billion Stock Buyback

yahoo-logo

Yahoo (YHOO) Increases Stock Buyback Plan, To Offer $1 billion of Convertible Notes

Yahoo (YHOO) announced today that they would be offering $1 billion of convertible notes due 2018 and are also increasing their buyback plan. YHOO has been aggressive in buying back shares recently, and has only $300 million left on their current plan. Management showed that they clearly feel Yahoo is still undervalued at current levels and would continue buying, announcing a $5 billion repurchase plan today, an amount that would account for nearly 1/7th of their outstanding shares at yesterday’s closing price. Yahoo currently has $3.2 billion in cash on their balance sheet and extremely valuable stakes in Alibaba and Yahoo Japan. They will be required to sell a significant percentage of their Alibaba stake in the event of an Alibaba IPO. Last week I highlighted numerous charts of YHOO, they have been a strong performer as of late and we expect shares to respond favorably to this news. I believe YHOO stock is a buy and will reach $40 within the next couple of months.

Disclosure: I have no positions in any stocks mentioned, and no plans to initiate any positions within the next 72 hours. I wrote this article myself, and it expresses my own opinions. I have no business relationship with any company whose stock is mentioned in this article.

Facebook (FB) stock plummets, downtrend remains intact

FB 2

Facebook (FB) fails to confirm break out, shares down sharply

After signaling a possible break out from their descending channel on Friday, shares of Facebook (FB) fell 6.5% today, indicating that their downtrend remains intact. The key level for FB to hold today was $49, shares gapped down from Friday’s close and trended down the remainder of the day, closing at their lowest price in more than a month. In what was a very bearish day for Facebook stock and the entire social media sector as a whole, shares failed to find support at $48 and could be headed lower in the short term unless a base can be formed at $46 during the next few trading sessions. We will be monitoring FB’s action closely this week.

Disclosure: I have no positions in any stocks mentioned, and no plans to initiate any positions within the next 72 hours. I wrote this article myself, and it expresses my own opinions. I have no business relationship with any company whose stock is mentioned in this article.

Bank of America (BAC) Nears Key Technical Level

BAC

Bank of America (BAC) Stock Has Momentum, Closing in on 52 Week High

After trending down for the past 2 1/2 months shares of Bank of America (BAC) have picked up some momentum, broke their downtrend, and are within 1% of their 52 week high. BAC could make a run at $15 today, and should  meet some resistance at that price. Given the recent strength of BAC, a move north of this level seems likely from a technical perspective. To get an idea of where shares could be headed from there we can check out a long term chart of Bank of America and see that there is not significant resistance until shares reach $18, which would represent a 20% upside from current levels. Should Bank of America fail to cross $15 and remain above that price in the short term, look for them to trend back down towards $13.75 before finding support. Their price action this week should be monitored very closely if you have a position in BAC or are currently considering entering one as it nears this key technical level.
BAC Long Term
Disclosure: I have no positions in any stocks mentioned, and no plans to initiate any positions within the next 72 hours. I wrote this article myself, and it expresses my own opinions. I have no business relationship with any company whose stock is mentioned in this article.

Facebook (FB) Shares Break Out of Downtrend

FB

Facebook (FB) Stock Forming Base at $49, Trading Above Descending Channel

Despite reporting earnings that easily exceeded expectations, some comments from the conference call spooked investors and sent shares of Facebook (FB) into a downtrend for the past month. Last week FB broke through the upside of their descending channel and appear to be forming a floor at $49. I viewed the market’s reaction to management’s comments during the CC as irrational and overstated and believe their long-term growth prospects are still well-intact. If shares have truly broke out of their downtrend and are forming a base at $49, this level should prove to be an attractive long-term entry point. We will be monitoring their price action closely today, looking for FB to remain above $49 and confirm their break out.

Disclosure: I have no positions in any stocks mentioned, and no plans to initiate any positions within the next 72 hours. I wrote this article myself, and it expresses my own opinions. I have no business relationship with any company whose stock is mentioned in this article.

How long will Yahoo (YHOO) Shares Keep Running

YHOO Long Term

Yahoo (YHOO) Could Find Resistance at $40

Yahoo (YHOO) shares have had quite a run as of late, up 10% in their last 5 trading days. After using a short-term chart of YHOO to anticipate their action this week, with shares now at a 7 year high it is necessary to take a look their long-term chart to determine where shares may next run into resistance. Looking at all available price action data available on Yahoo’s stock, we can see that historically shares have been met with a good deal of resistance near $40, only eclipsing that figure for a meaningful amount of time during the internet bubble of 1999. Coincidentally, when analyzing Yahoo’s fundamentals last month, the high-end of our determined fair valuation range for YHOO was $40. From both a technical and fundamental perspective I believe shares will appreciate by another 12% in the short-term barring a major downturn in the US equity markets.

Disclosure: I have no positions in any stocks mentioned, and no plans to initiate any positions within the next 72 hours. I wrote this article myself, and it expresses my own opinions. I have no business relationship with any company whose stock is mentioned in this article.

Foot Locker (FL) Stock Near 23 Year High

FL

Foot Locker (FL) Share’s Rally Should Extend

Less than 3 weeks ago I recommended buying shares of Foot Locker (FL) as a means of capitalizing on the growth of the athletic apparel sector at a much cheaper valuation than Nike (NKE), Adidas (ADDYY), or Under Armour (UA) can be purchased at. Shares are up 9% since then and are now approaching their highest level since 1990. In August Foot Locker traded as high as $37.85, and we will be watching closely as the stock looks to take out that level in the next few trading sessions. In the past 3 months FL has tested and bounced off of their long-term uptrend line multiple times, a very bullish sign for investors. Very similar to what we’ve seen with Yahoo (YHOO) this week, Foot Locker has a great deal of upside above their 52 week high from a technical perspective with virtually no overhead resistance. More importantly they also possess the fundamentals to warrant significant appreciation. The athletic apparel sector as a whole is thriving right now with NKE, ADDYY, UA, Dicks (DKS), and Finish Line (FINL) all at or near all-time highs. Foot Locker the strongest balance sheet of the group, trades at the lowest multiples, and has a buyback program in place that will account for nearly 10% of outstanding shares. FL remains a strong buy and one of our top picks.

Disclosure: I have no positions in any stocks mentioned, and no plans to initiate any positions within the next 72 hours. I wrote this article myself, and it expresses my own opinions. I have no business relationship with any company whose stock is mentioned in this article.

Yahoo (YHOO) Shares Close at New 52 Week High

YHOO 4

Yahoo (YHOO) Stock at 52 Week High, Highest Price Since January 2006

Yahoo (YHOO) is making a lot of people look/ feel pretty smart this week as shares continued their surge today. YHOO opened down this morning but remained in a steady uptrend throughout the day, filling the gap on their chart created by yesterday’s price action and setting a new 52 week high in the process. Not just a 52 week high, today was Yahoo’s highest closing price since January 2006. As mentioned yesterday, there is no overhead resistance on YHOO’s chart now and shares have plenty of room to continue their run. In my analysis of Yahoo last month I suggested they were undervalued and that their fair value was in the range of $38- $40 per share. I will review and update my recommendation of YHOO next week if shares continue to close in on my target price.

Disclosure: I have no positions in any stocks mentioned, and no plans to initiate any positions within the next 72 hours. I wrote this article myself, and it expresses my own opinions. I have no business relationship with any company whose stock is mentioned in this article.

Go to top